3000+
employers across India reported a seasonally adjusted Net Employment Outlook (NEO)

employers across India reported a seasonally adjusted Net Employment Outlook (NEO)
as they forecast Q2 staffing changes in the latest edition of the ManpowerGroup Employment Outlook Survey.
of employers said they planned to increase their staff between April and June.
quarter-on-quarter (QoQ)
year-over-year (YoY)
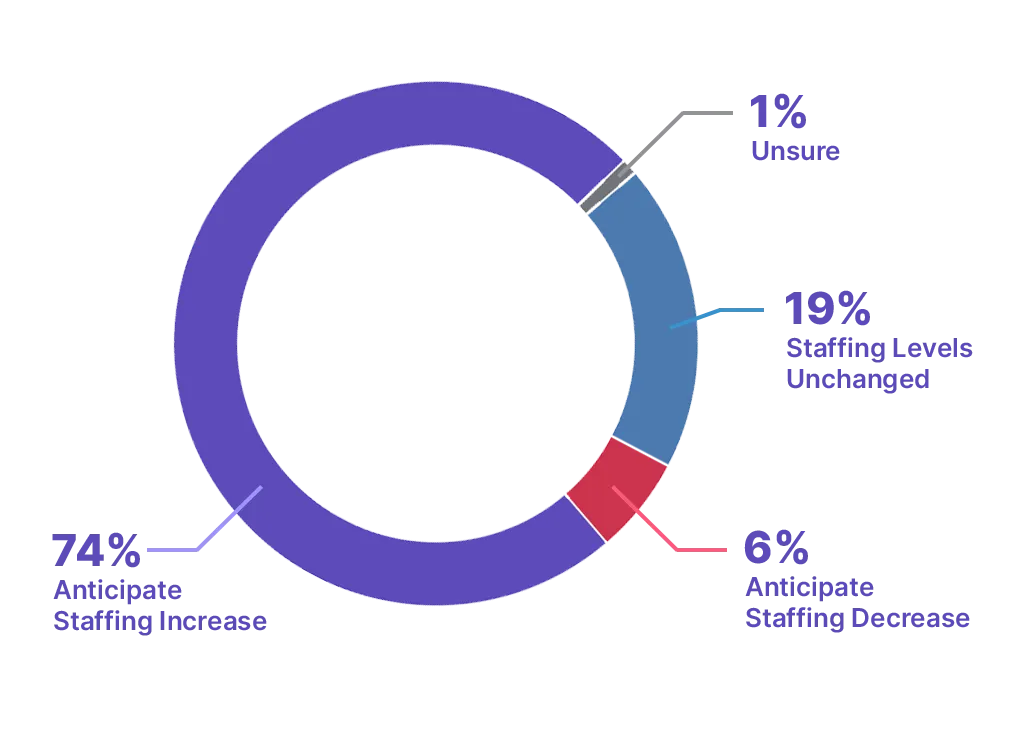
shared whether their staffing levels would remain unchanged, increase through new hiring, or decrease due to layoffs or anticipated departures.
The ManpowerGroup Employment Outlook Survey is the world’s most comprehensive and forward-looking employment survey, serving as a trusted labor market indicator since 1962.
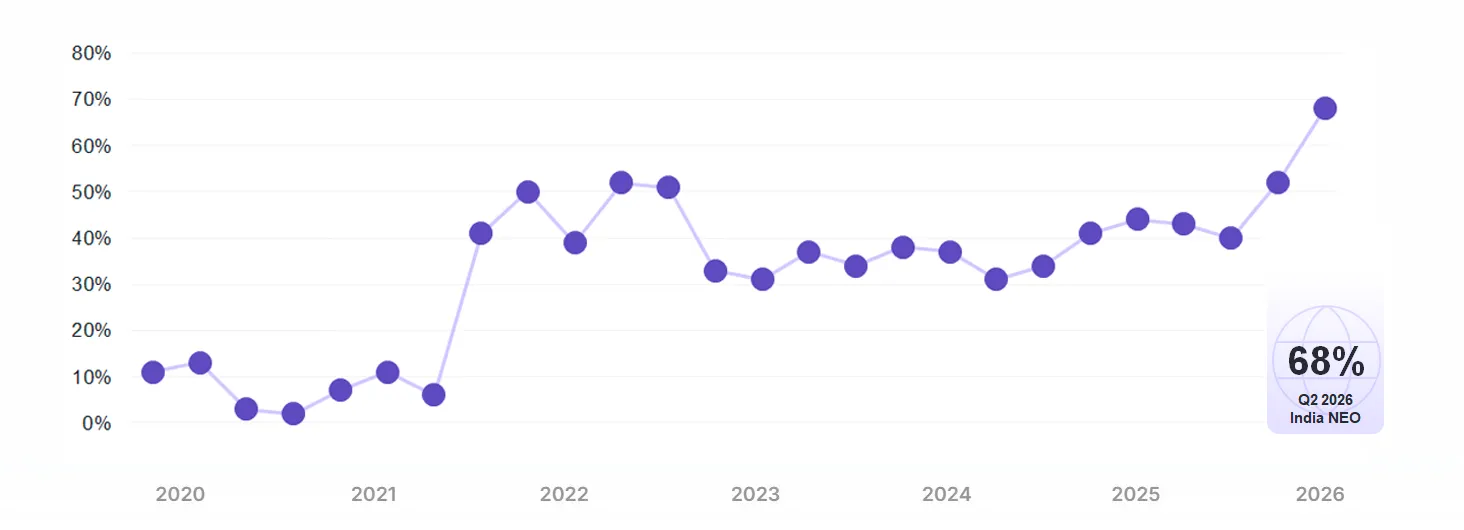
The Net Employment Outlook (NEO) measures the % difference between expected increases and decreases in staffing for the quarter.
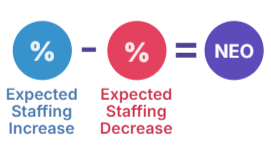

Hiring sentiment is quantified using the Net Employment Outlook (NEO), defined as the difference between the percentage of employers
planning to increase staff and those planning to reduce staff.
The NEO for the second quarter of 2026 is 68%, both before and after the data was seasonally adjusted to remove the influence of predictable seasonal patterns.
The seasonally adjusted figure is used throughout the remainder of this report unless otherwise noted.
The ManpowerGroup Employment Outlook Survey is the most comprehensive, forward-looking employment survey of its kind, used globally as a key economic indicator. The Net Employment Outlook is derived by taking the percentage of employers anticipating an increase in hiring activity and subtracting from this the percentage of employers expecting a decrease in hiring activity. Running since 1962, various factors underpin the success of the Survey:
The ManpowerGroup Employment Outlook Survey is the most extensive, forward-looking employment survey in the world, asking employers to forecast employment over the next quarter. In contrast, other surveys and studies focus on retrospective data to report on what occurred in the past.
The survey is conducted with a representative sample of employers from throughout the countries and territories in which it is conducted. The survey participants are not derived from ManpowerGroup’s customer base.

This sample allows for analysis to be performed across specific sectors and regions to provide more detailed information.
For more than six decades the survey has derived all of its information from a single question (Q2 2026 example):
Survey responses were collected from January 1 – February 3, 2026. The size of organizations and sectors are standardized across all countries to allow international comparisons.
ManpowerGroup has introduced an updated industry sector classification to ensure our insights more closely reflect today’s global economy.
Beginning with the Q1 2026 release, data will be reported across nine sectors: Construction & Real Estate; Finance & Insurance; Hospitality;
Information; Manufacturing; Professional, Scientific & Technical Services; Public Sector, Health & Social Services; and Trade & Logistics.
Historical data has been reclassified to maintain consistency over time, and national and regional results remain unchanged.

This website and its materials contain forward-looking statements, including statements regarding labor demand in certain regions, countries and industries, and economic uncertainty. Actual events or results may differ materially from those contained in the forward-looking statements, due to risks, uncertainties and assumptions. These factors include those found in the Company's reports filed with the U.S. Securities and Exchange Commission (SEC), including the information under the heading "Risk Factors" in its Annual Report on Form 10-K for the year ended December 31, 2025, whose information is incorporated herein by reference. ManpowerGroup disclaims any obligation to update any forward-looking or other statements in this release, except as required by law.
FAQDive deeper into data and trends, including pay equity and beyond.