
"India’s hiring outlook is not just strong - it is signaling a new phase of economic confidence and capability-building.
What these trends truly reflect is India’s transition from volume-led hiring to value creation: organizations are investing
in the skills, technologies, and talent architectures that will define their competitiveness over the next decade.
Demand in sectors such as finance, professional services, manufacturing, and real estate shows that employers are
actively preparing for a more digital, regulated, and innovation-driven economy. The moderation in hiring intensity,
especially among large enterprises, is often misunderstood. It is strategic - not cautious. Companies are re-engineering
their workforce models, prioritizing high-impact roles, and blending permanent, specialist, and flexible talent to stay
resilient amid shifting global dynamics. This is workforce transformation with intent, not attrition.
As we move into 2026, India will shape its talent market around three fundamentals: critical skills, technological
leverage, and purposeful expansion. Organizations that build around these pillars will not only withstand disruption but
lead it. And for India’s skilled professionals, this creates an unprecedented runway of opportunity to contribute to the
country’s next wave of growth and global leadership."

Get insights into Indian employers' hiring plans across nine sectors and how employers are navigating talent challenges.
Key Findings
-
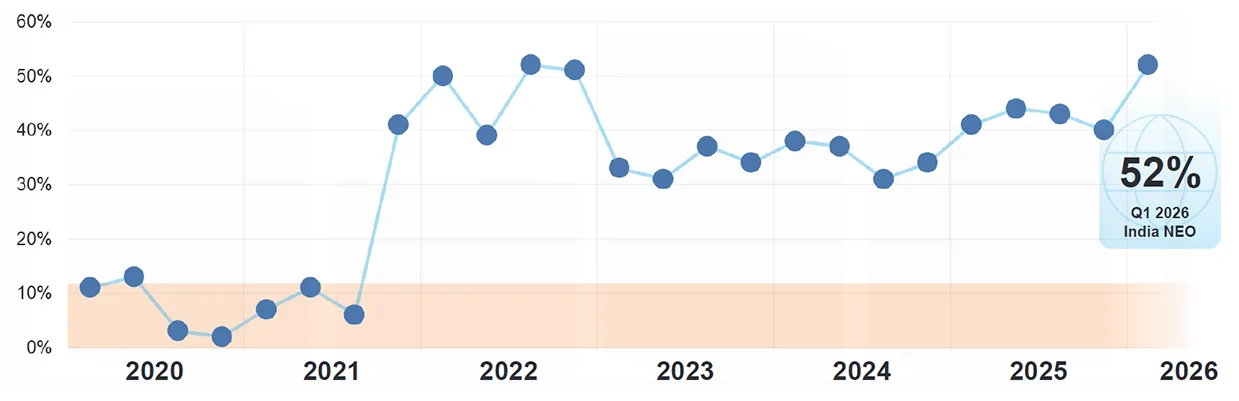
The Net Employment Outlook (NEO) has increased to 52, as Employers are more optimistic about hiring in Q1 2026.
-
Despite a positive outlook over the past year, hiring volumes have fallen.
-
East region reports the greatest increase in employment outlooks followed by North & West over Q4 2025.
-
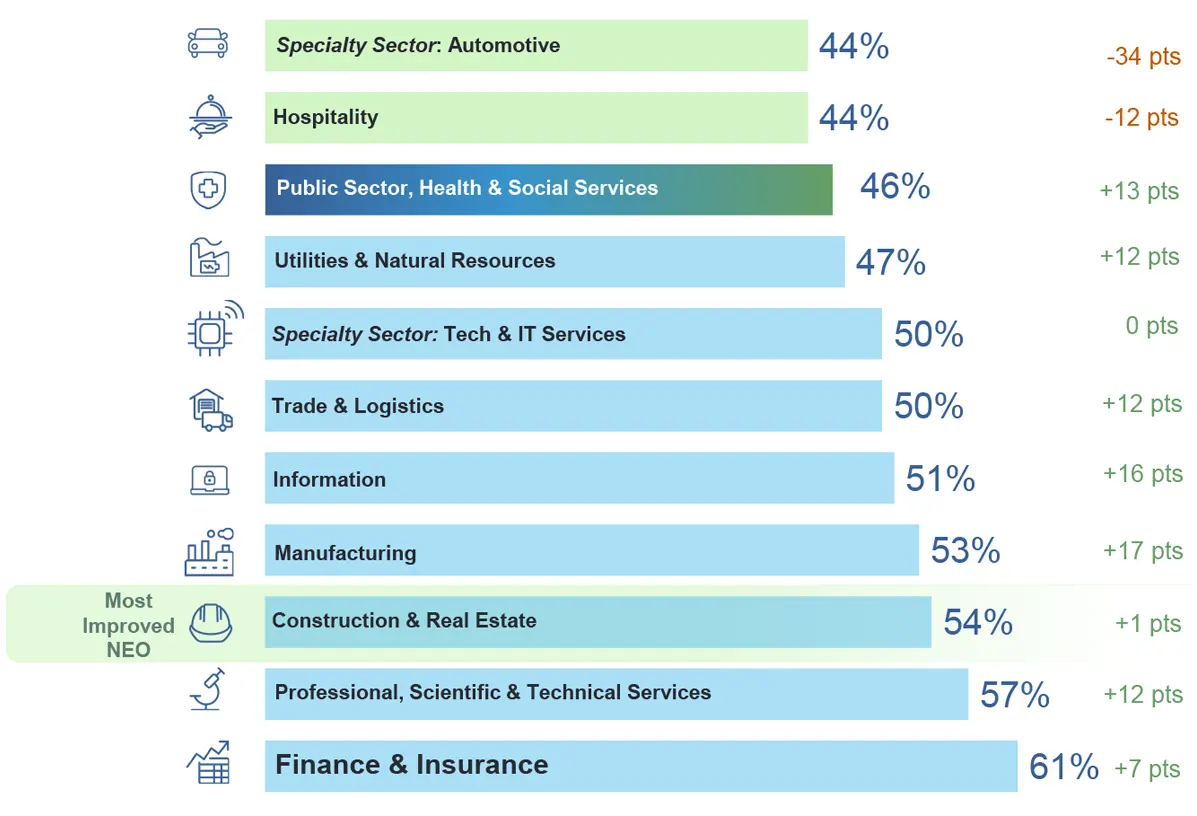
The sectors with the greatest hiring expectations are Finance & Insurance (61) and Professional, Scientific & Technical Services (57).
-
The largest companies experienced the slowest growth, have also cut back their hiring the most sharply.
-
Hiring increases are driven by company expansion. Hiring decreases are driven by automation challenges.
-
India’s Employment Outlook has increased by 11 points since the previous quarter and by 12 points when compared to Q1 2025.
Outlooks Across Key Industry Sectors
Finance & Insurance employers reported the highest NEO,while Construction & Real Estate marked the most improved when compared to the previous quarter.
Specialty Sector: Tech & IT Services is a specialty sector that combines subsectors across Manufacturing, Information, and Professional Services to provide a holistic view of all aspects relating to IT and telecom.Automotive sector combines subsectors across - Auto Components, Automobiles, Motor Vehicle Manufacturing/Body & Trailer Manufacturing/Vehicle Parts and Supplies Wholesalers & Dealers
Downloads
More than 3,000 employers across India reported a seasonally adjusted Net Employment Outlook (NEO) of 52% as they forecast Q1 staffing changes in the latest edition of the ManpowerGroup Employment Outlook Survey.
Find The Talent and Solutions You Need
To discuss the results personally or explore how ManpowerGroup can help you find the talent and solutions needed to propel your organization forward, contact us today.
About the ManpowerGroup Employment Outlook Survey
What is the ManpowerGroup Employment Outlook Survey?
The ManpowerGroup Employment Outlook Survey is the most comprehensive, forward-looking employment survey of its kind, used globally as a key economic indicator. The Net Employment Outlook is derived by taking the percentage of employers anticipating an increase in hiring activity and subtracting from this the percentage of employers expecting a decrease in hiring activity. Running since 1962, various factors underpin the success of the Survey:
Unique – It is unparalleled in its size, scope, longevity and area of focus. The ManpowerGroup Employment Outlook Survey is the most extensive, forward-looking employment survey in the world, asking employers to forecast employment over the next quarter. In contrast, other surveys and studies focus on retrospective data to report on what occurred in the past.Independent – The survey is conducted with a representative sample of employers from throughout the countries and territories in which it is conducted. The survey participants are not derived from ManpowerGroup’s customer base.
Robust – The survey is based on interviews with 39,063 public and private employers across 41 countries to measure anticipated employment trends each quarter. This sample allows for analysis to be performed across specific sectors and regions to provide more detailed information.
Focused – For more than six decades the survey has derived all of its information from a single question (Q1 2026 example): “How do you anticipate total employment at your location to change in the three months to the end of March 2026 as compared to the current quarter?"
Survey Methodology – Survey responses were collected from October 1-31, 2025. Size of organization and sector are standardized across all countries and territories to allow international comparisons.
Forward-looking Statements
This report contains forward-looking statements, including statements regarding labor demand in certain regions, countries and industries, and economic uncertainty. Actual events or results may differ materially from those contained in the forward-looking statements, due to risks, uncertainties and assumptions. These factors include those found in the Company's reports filed with the U.S. Securities and Exchange Commission (SEC), including the information under the heading "Risk Factors" in its Annual Report on Form 10-K for the year ended December 31, 2024, whose information is incorporated herein by reference. ManpowerGroup disclaims any obligation to update any forward-looking or other statements in this release, except as required by law.
What questions do you ask in the survey?
All the data in the survey is based on the answer to one question: How do you anticipate total employment at your location to change in the coming three months as compared to the current quarter?
In addition to the main employment question, the survey asks up to six additional questions which change quarterly. These questions reflect changing economic or workforce dynamics and trends. Topic areas range from talent shortage to workforce training and development to employee sentiments and well-being.
What is meant by Net Employment Outlook (NEO)?
The Net Employment Outlook is derived by taking the percentage of employers anticipating an increase in hiring activity and subtracting from this the percentage of employers that expect to see a decrease in employment at their location in the next quarter. A positive Net Employment Outlook figure means that, on balance, there are more employers who expect to add to their headcount in the following three months than those who intend to reduce staff.
Does the survey provide data on planned employment changes?
The ManpowerGroup Employment Outlook Survey only measures if employers expect to hire or not and does not provide information about specific job changes. The Survey is a forecast, not a commitment, based on informed opinions from employers and hiring managers on what will likely happen in their organization in the following quarter.
What is the survey methodology?
Survey responses were collected from October 1-31, 2025. Size of organization and sector are standardized across all countries and territories to allow international comparisons.
How are companies selected for the survey?
Employers are selected based on the types of companies and organizations they represent. We want to ensure that our panel is representative of each participating country’s national labor market, so each country’s panel is built in proportion to that country’s overall distribution of industry sectors and organization sizes.
Who do you interview in each company?
The person we select to interview will be someone with a good overview of staffing levels and hiring intentions within their organization. Normally this will be the head of HR or an HR manager. However, in smaller organizations, that person may be a general manager or even the CEO.
Who conducts the research?
Reputation Leaders is our lead research partner who analyzes data for all 41 countries and territories to ensure consistency.
What is Seasonal Adjustment and why is it used in the ManpowerGroup Employment Outlook Survey?
Seasonal adjustment is a statistical process that allows the Survey data to be presented without the impact of hiring fluctuations that normally occur through the course of the year, usually as a result of various external factors, such changes in weather, traditional production cycles, and public holidays. Seasonal adjustment has the effect of flattening peaks and smoothing troughs in the data to better illustrate underlying employment trends and provide a more accurate representation of the ManpowerGroup Employment Outlook Survey results.
How are the Industry Sectors Defined in Q1 2026 MEOS?
Beginning with the Q1 2026 survey, the industry sectors have been updated to align with the North American Industry Classification System (NAICS). Historical data has been reclassified and will still be available as defined below.
Construction & Real Estate: Construction;Real Estate; Building Products; Construction & Engineering; Trading Companies & Distributors; Other Industrials Sub-Industry; Construction Materials; Real Estate Management & Development; Construction of Buildings; Heavy and Civil Engineering Construction; Specialty Trade Contractors; Rental and Leasing Services; and Lessors of Nonfinancial Intangible Assets.
Banking, Finance and Insurance: Banks; Thrifts & Mortgage Finance; Diversified Financial Services; Consumer Finance; Capital Markets; Mortgage Real Estate Investment Trusts; Insurance; Equity Real Estate Investment Trusts; Other Financials & Real Estate Sub-Industry; Monetary Authorities-Central Bank; Credit Intermediation and Related Activities; Securities, Commodity Contracts, and Other Financial Investments and Related Activities; Insurance Carriers and Related Activities; Funds, Trusts, and Other Financial Vehicles.
Hospitality: Leisure Facilities, Gaming & Casinos; Accommodation, Restaurants, Hotels, Resorts & Cruise Lines; Arts, Entertainment, and Recreation; Accommodation and Food Services.
Information: Software; Communications Equipment; Technology Hardware, Storage & Peripherals; Other IT Sub-Industry; Diversified Telecommunication Services; Wireless Telecommunication Services; Media and Publishing; Entertainment; Interactive Media & Services; Other Communication Sub-Industry; Motion Picture and Sound Recording Industries; Newspaper, Periodical, Book, and Directory Publishers; Software Publishers; Broadcasting and Content Providers; Telecommunications; Computing Infrastructure Providers, Data Processing, Web Hosting, and Related Services; Web Search Portals, Libraries, Archives, and Other Information Services.
Manufacturing: Manufacturing; Aerospace & Defense; Electrical Equipment; Machinery; Chemicals; Other Materials Sub-Industry; Electronic Equipment, Instruments & Components; Semiconductors & Semiconductor Equipment; Industrials Manufacturing; Energy & Utilities Manufacturing; Materials Manufacturing; Transportation Manufacturing; Consumer Goods & Services Manufacturing; Health Care & Life Sciences Manufacturing; IT Manufacturing; Communication Services Manufacturing; Other Manufacturing; Food Manufacturing; Beverage and Tobacco Product Manufacturing; Textile Mills; Textile Product Mills; Apparel Manufacturing; Leather and Allied Product Manufacturing; Wood Product Manufacturing; Paper Manufacturing; Printing and Related Support Activities; Petroleum and Coal Products Manufacturing; Basic Chemical Manufacturing; Resin, Synthetic Rubber, and Artificial and Synthetic Fibers and Filaments Manufacturing; Pesticide, Fertilizer, and Other Agricultural Chemical Manufacturing; Pharmaceutical and Medicine Manufacturing; Paint, Coating, and Adhesive Manufacturing; Soap, Cleaning Compound, and Toilet Preparation Manufacturing; Other Chemical Product and Preparation Manufacturing; Plastics and Rubber Products Manufacturing; Nonmetallic Mineral Product Manufacturing; Primary Metal Manufacturing; Fabricated Metal Product Manufacturing; Machinery Manufacturing; Computer and Peripheral Equipment Manufacturing; Communications Equipment Manufacturing; Audio and Video Equipment Manufacturing; Semiconductor and Other Electronic Component Manufacturing; Navigational, Measuring, Electromedical, and Control Instruments Manufacturing; Manufacturing and Reproducing Magnetic and Optical Media; Electrical Equipment, Appliance, and Component Manufacturing; Motor Vehicle Manufacturing; Motor Vehicle Body and Trailer Manufacturing; Motor Vehicle Parts Manufacturing; Aerospace Product and Parts Manufacturing; Railroad Rolling Stock Manufacturing; Ship and Boat Building; Other Transportation Equipment Manufacturing; Furniture and Related Product Manufacturing; Miscellaneous Manufacturing.
Professional, Scientific & Technical Services: Professional, Scientific and Technical Activities; Commercial Services & Supplies; Professional Services; Specialized Consumer Services; IT Services; Administrative and Support Services; Legal Services; Accounting, Tax Preparation, Bookkeeping, and Payroll Services; Architectural, Engineering, and Related Services; Specialized Design Services; Computer Systems Design and Related Services; Management, Scientific, and Technical Consulting Services; Scientific Research and Development Services; Advertising, Public Relations, and Related Services; Other Professional, Scientific, and Technical Services; Management of Companies and Enterprises.
Public Sector, Health & Social Services: Education; Human Health and Social Work; Government (National or Local) or Public Service; Education Services; Health Care Equipment & Supplies; Health Care Providers & Services; Health Care Technology; Biotechnology; Pharmaceuticals; Life Sciences Tools & Services; Other Health Care & Life Sciences Sub-Industry; Not for Profit / Charity / Religious Organization; Educational Institutions; Educational Services; Health Care and Social Assistance; Other Services (except Public Administration); Public Administration.
Trade & Logistics: Wholesale and Retail Trade; Repair of Vehicles; Containers & Packaging; Paper & Forest Products; Air Freight & Logistics; Airlines; Marine; Road & Rail; Transportation Infrastructure; Auto Components; Automobiles; Other Transport, Logistics & Automobiles Sub-Industry; Household Durables; Leisure Products; Textiles, Apparel & Luxury Goods; Distributors; Online & Direct Marketing Retail; Multiline Retail (Department Stores, etc.); Specialty Retail (Apparel, Technology, etc.); Other Consumer Discretionary Goods & Services Sub-Industry; Food & Staples Retailing; Beverages; Food Products; Tobacco; Household Products; Personal Products; Other Consumer Staples Sub-Industry; Motor Vehicle and Motor Vehicle Parts and Supplies Merchant Wholesalers; Furniture and Home Furnishing Merchant Wholesalers; Lumber and Other Construction Materials Merchant Wholesalers; Professional and Commercial Equipment and Supplies Merchant Wholesalers; Metal and Mineral (except Petroleum) Merchant Wholesalers; Household Appliances and Electrical and Electronic Goods Merchant Wholesalers; Hardware, and Plumbing and Heating Equipment and Supplies Merchant Wholesalers; Machinery, Equipment, and Supplies Merchant Wholesalers; Miscellaneous Durable Goods Merchant Wholesalers; Paper and Paper Product Merchant Wholesalers; Drugs and Druggists' Sundries Merchant Wholesalers; Apparel, Piece Goods, and Notions Merchant Wholesalers; Grocery and Related Product Merchant Wholesalers; Farm Product Raw Material Merchant Wholesalers; Chemical and Allied Products Merchant Wholesalers; Petroleum and Petroleum Products Merchant Wholesalers; Beer, Wine, and Distilled Alcoholic Beverage Merchant Wholesalers; Miscellaneous Nondurable Goods Merchant Wholesalers; Wholesale Trade Agents and Brokers; Motor Vehicle and Parts Dealers; Building Material and Garden Equipment and Supplies Dealers; Food and Beverage Retailers; Furniture, Home Furnishings, Electronics, and Appliance Retailers; General Merchandise Retailers; Health and Personal Care Retailers; Gasoline Stations and Fuel Dealers; Clothing, Clothing Accessories, Shoe, and Jewelry Retailers; Sporting Goods, Hobby, Musical Instrument, Book, and Miscellaneous Retailers; Air Transportation; Rail Transportation; Water Transportation; Truck Transportation; Transit and Ground Passenger Transportation; Pipeline Transportation; Scenic and Sightseeing Transportation; Support Activities for Transportation; Postal Service; Couriers and Messengers; Warehousing and Storage.
Utilities & Natural Resources: Mining and Quarrying; Electricity, Gas and Air Conditioning Supply; Water Supply; Sewerage, Waste Management and Remediation Activities; Energy Equipment & Services; Oil, Gas & Consumable Fuels; Electric Utilities; Gas Utilities; Multi-Utilities; Water Utilities; Waste Remediation; Independent Power and Renewable Electricity Producers; Other Energy and Utilities Sub-Industry; Metals & Mining; Agriculture and Fishing; Agriculture, Forestry, Fishing and Hunting; Oil and Gas Extraction; Mining (except Oil and Gas); Support Activities for Mining; Utilities; Waste Management and Remediation Services.